Analysts tend to miss the forest for the trees. In retail they are obsessed with the business model drivers like sales per square foot, same store sales or gross margin. Certainly, these metrics are important for understanding the dynamics of a retail business - but to what end?
The bottom line is whether a business model and management team create value per share - that's the single minded objective function for any for profit business. It's the only one that allows for principled trade-offs between competing subordinate goals. The answer is always the combination of drivers that will yield the most value over time.
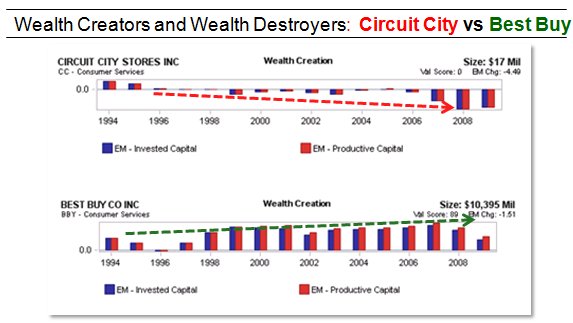
AFGview.com's economic margin framework accomplishes this simple but overlooked goal. See below for an example comparison of Best Buy to Circuit City.
On ValueExpectations.com we always talk about a company’s true economic profitability (Economic Margin) to see through some of the distortions caused by traditional accounting practices and better understand what a company is truly earning above or below its cost of capital# We have shown through numerous examples that a company’s Economic Margin (EM) level is highly correlated with its market performance and an increase in margins typically leads to market out performance, where a decline in margins leads to market under performance# The example below shows both ends of the spectrum, one company that generates positive EMs and is able to grow its business while maintaining its profitability while the other company was unable to earn its cost of capital and consistently deteriorated its EMs.
It is no surprise based on economic profitability that Best Buy Co., Inc. is still doing quite well in the retail arena and has done a good job of growing its business while maintaining its profitability. The market tends to reward companies that grow profitable businesses and relative to the market BBY has consistently outperformed the S&P 500. Circuit City on the other hand deteriorated its EMs over time and eventually was unable to survive.
The Economic Margin (EM) Framework was developed to evaluate corporate performance from an economic cash flow perspective and is an alternative to accounting-based valuation metrics. EM measures the return a company earns above or below its cost of capital and provides a more complete view of a company’s underlying economic strength.
EM is meant to serves two purposes: Create a measure of a company’s economic profitability; that is, did this company generate cash flow in excess of the costs of its capital invested in its operations, or did the company destroy wealth? Once we have solved for this, we can then use this EM as a function in our valuation model.
EM is calculated by dividing a company’s Operating Cash Flow minus Capital Charge by their Invested Capital.

It is not uncommon for companies to grow EPS while having declining or negative EM’s. This occurs when the cost for the investment required to yield the EPS (cost of capital) is more than the cash flow generated from the investment. From an economic perspective, this is growing EPS at the expense of the economics of the business.
Unlike traditional measures, EM considers the “profitability” of EPS growth, eliminates accounting distortions, and are comparable across time and industry. By analyzing a company’s EMs through time, investors gain a more accurate account of levels and changes in a company’s current profitability and value.
No comments:
Post a Comment